
Activity and traces
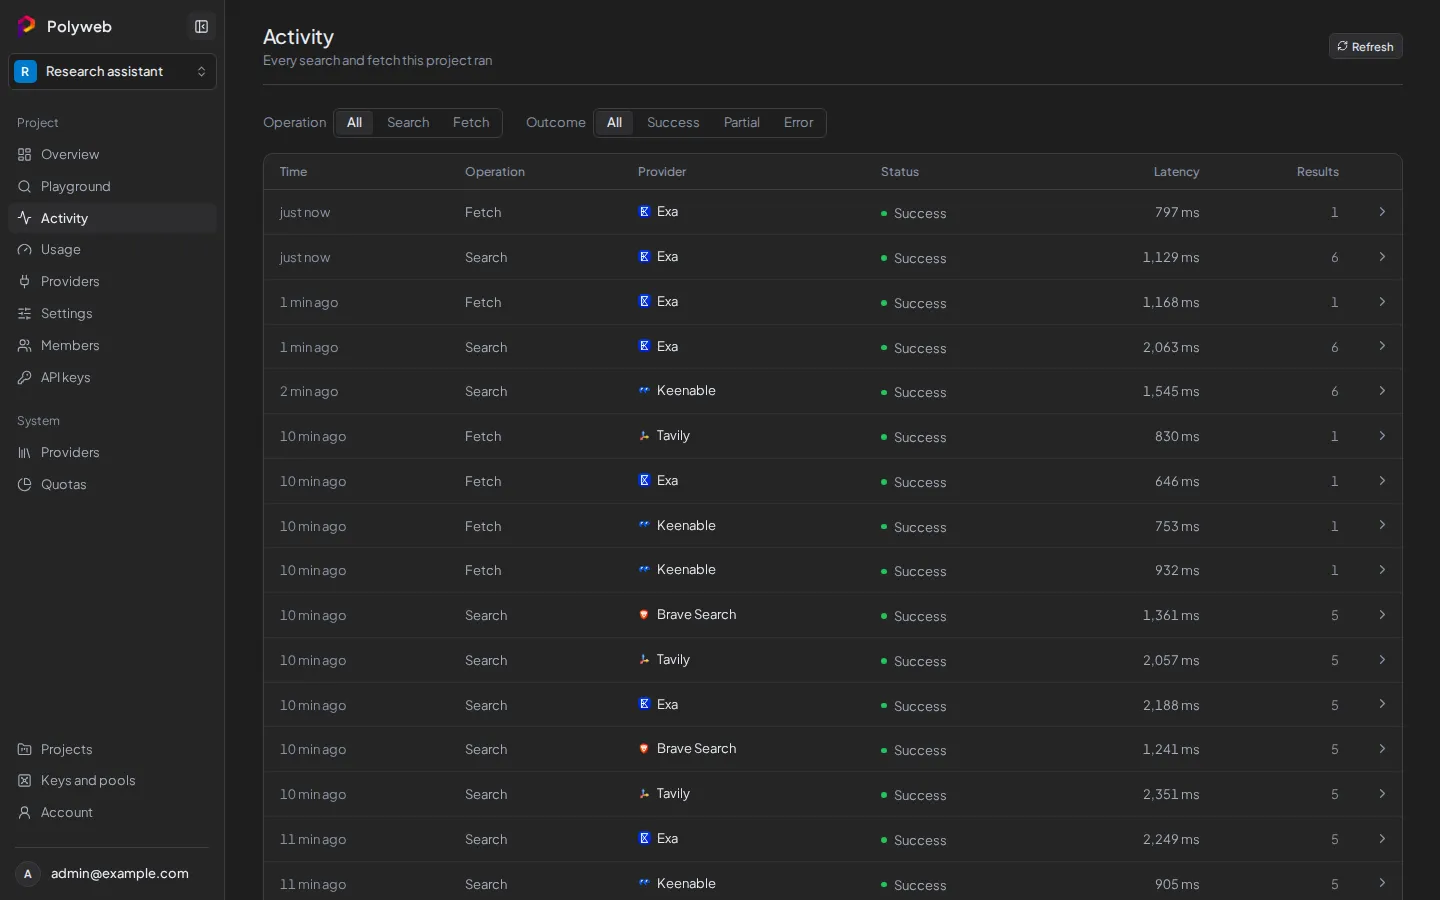
Every search and fetch call, from the dashboard, the REST API or an MCP client, is recorded as a trace. The Activity page lists them, newest first. You need the View activity permission (traces.read).
Reading Activity doesn’t create traces. Health checks, the dashboard’s own reads and static requests aren’t traced either.
Find a call
Section titled “Find a call”The table has the columns Time, Operation, Provider, Status, Latency and Results.
- Open your project, then open Activity.
- Use the Operation filter (All, Search, Fetch) and the Outcome filter (All, Success, Partial, Error). The filters are kept in the page address.
- Select Refresh to load new calls. Select Load more at the bottom for older ones.
Partial means a provider failed but another one answered, so the caller still got a result. A row for All providers has an arrow: open it to see each provider’s attempt.
Every REST and MCP answer carries an X-Trace-Id header (32 lowercase hex characters). It matches the trace_id of the trace, so you can find the call an agent made.
Open a trace
Section titled “Open a trace”Select a row (or View details) to open Trace detail. It starts with a summary: Status, Provider, Total latency and Results.
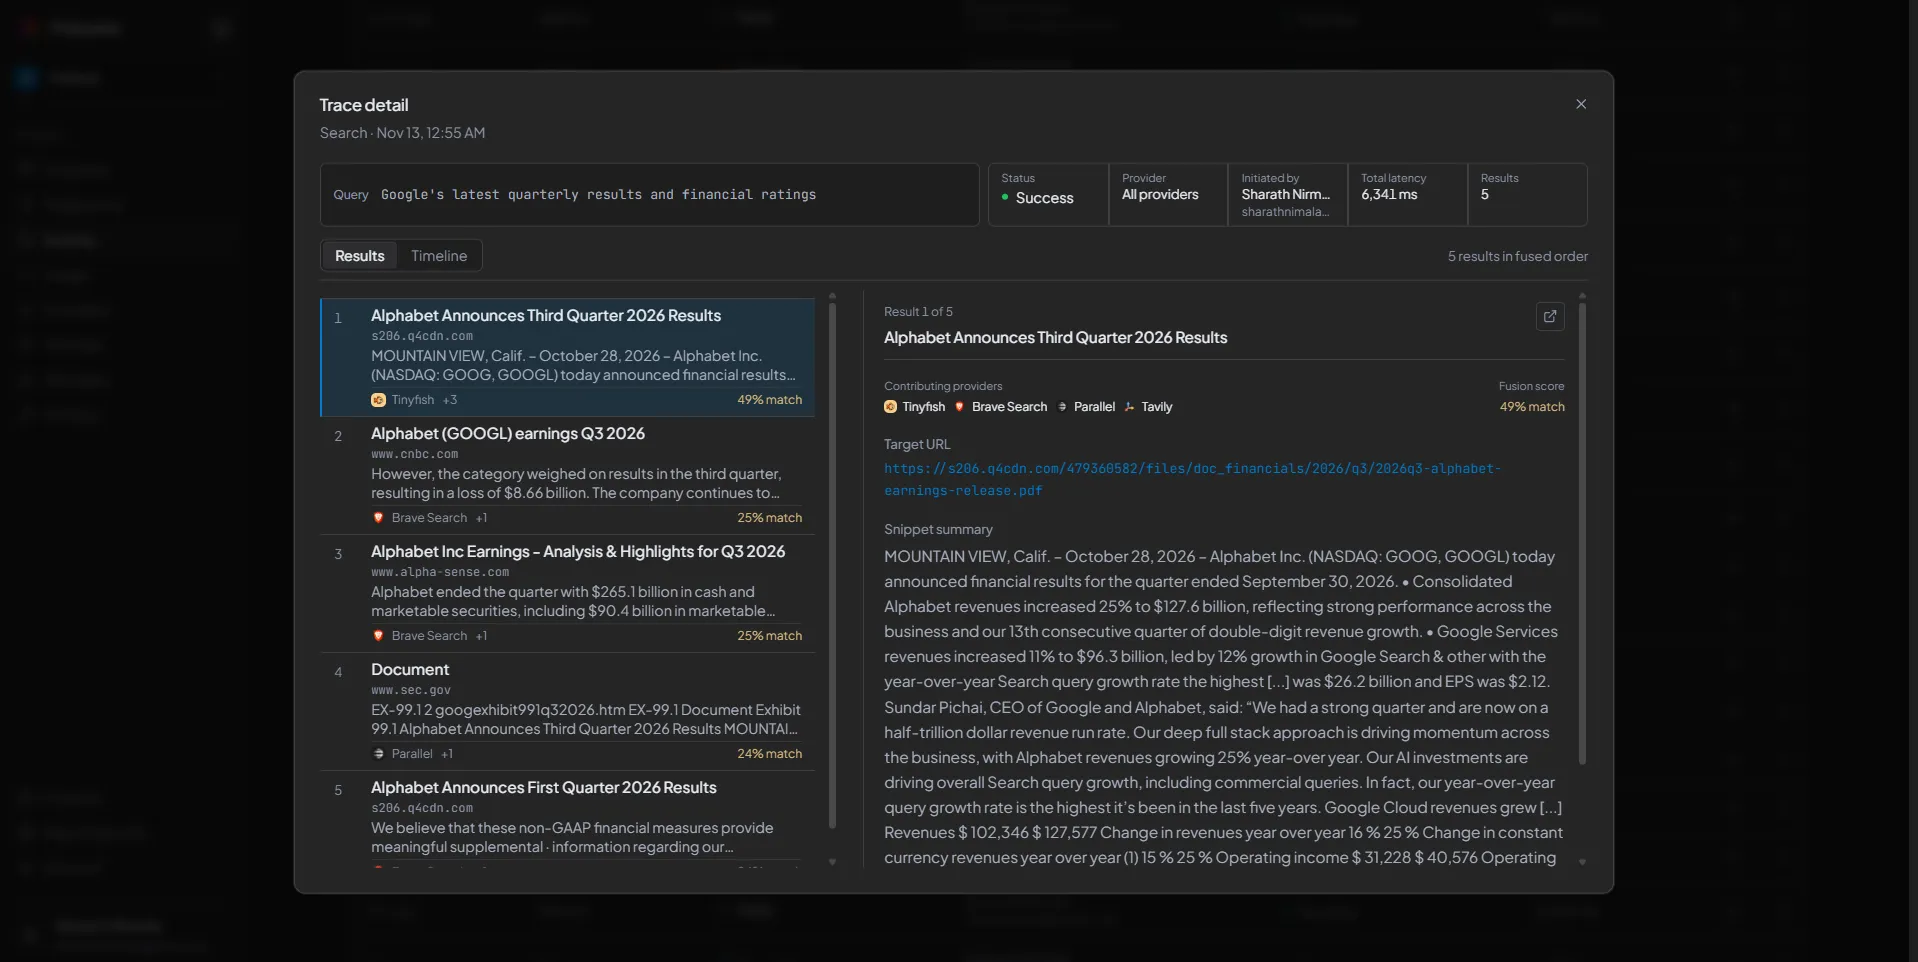
Two views sit below it.
- Results shows the Query (or URL) and the Ranked results. Select a result to inspect it.
- Timeline shows each stage of the call with its timing: the request, the route choice, each provider call, parsing and the response. Select a stage to see its recorded data.
A trace with a Metadata only tag stored timing only, so there’s no query or results to show and the first view is called Summary.
What gets stored
Section titled “What gets stored”Each project’s trace policy decides how much is kept. Metadata only stores timing, provider, outcome, counts and span metadata. Full requests also stores the query or URL and the normalized results. The policy is fixed when a request starts, so changing it later doesn’t affect a call already running. Secrets, API keys and cookies are never stored.
Trace content is kept in the Polyweb database and is sensitive. It stays until the project’s retention setting deletes it. Change both settings under Project settings and members.
To turn tracing off for the whole installation, set POLYWEB_OTEL_PROCESSOR=none and restart. Then calls get no X-Trace-Id header and Activity stays empty. The default is database. See Configuration.
Read traces over REST
Section titled “Read traces over REST”The dashboard uses two routes you can call yourself with a signed-in user’s access token. Project API keys don’t work here.
curl http://localhost:8001/api/v1/projects/PROJECT_ID/traces \ -H "Authorization: Bearer ACCESS_TOKEN"curl http://localhost:8001/api/v1/projects/PROJECT_ID/traces/TRACE_ID \ -H "Authorization: Bearer ACCESS_TOKEN"The list accepts limit, operation (search or fetch), outcome and cursor. A trace from another project returns 404.
Troubleshooting
Section titled “Troubleshooting”| Symptom | Fix |
|---|---|
| “No traces recorded yet” | Run a search or fetch in the Playground. |
| “No traces match these filters” | Set both filters to All. |
| Activity is missing from the sidebar | You lack View activity. Ask a project admin. |
No X-Trace-Id header |
Tracing is off. Set POLYWEB_OTEL_PROCESSOR=database and restart. |
Next steps
Section titled “Next steps”- See totals per provider in Usage.